How
our
Marketing
Mix
Modelling

helped
Blunt
scale
with
confidence
What is Marketing Mix Modeling?
Think of MMM as your marketing GPS. Unlike ad platforms, it isn’t paid to prefer one channel over another. It simply shows which channels truly drive revenue, which ones quietly burn budget, and gives you a clear, data-backed plan for where to put your next dollar.

“Double’s MMM model helped us cut through the noise. It gave us clarity on what’s actually driving growth - and the confidence to invest with intention...which, in marketing, feels like a small miracle.”

Ecommerce & Digital Manager
The Complete Picture
BLUNT was growing fast, but lacked a clear view of what was driving performance. International expansion made that clarity even more critical.

The Problem

The Solution

The Output
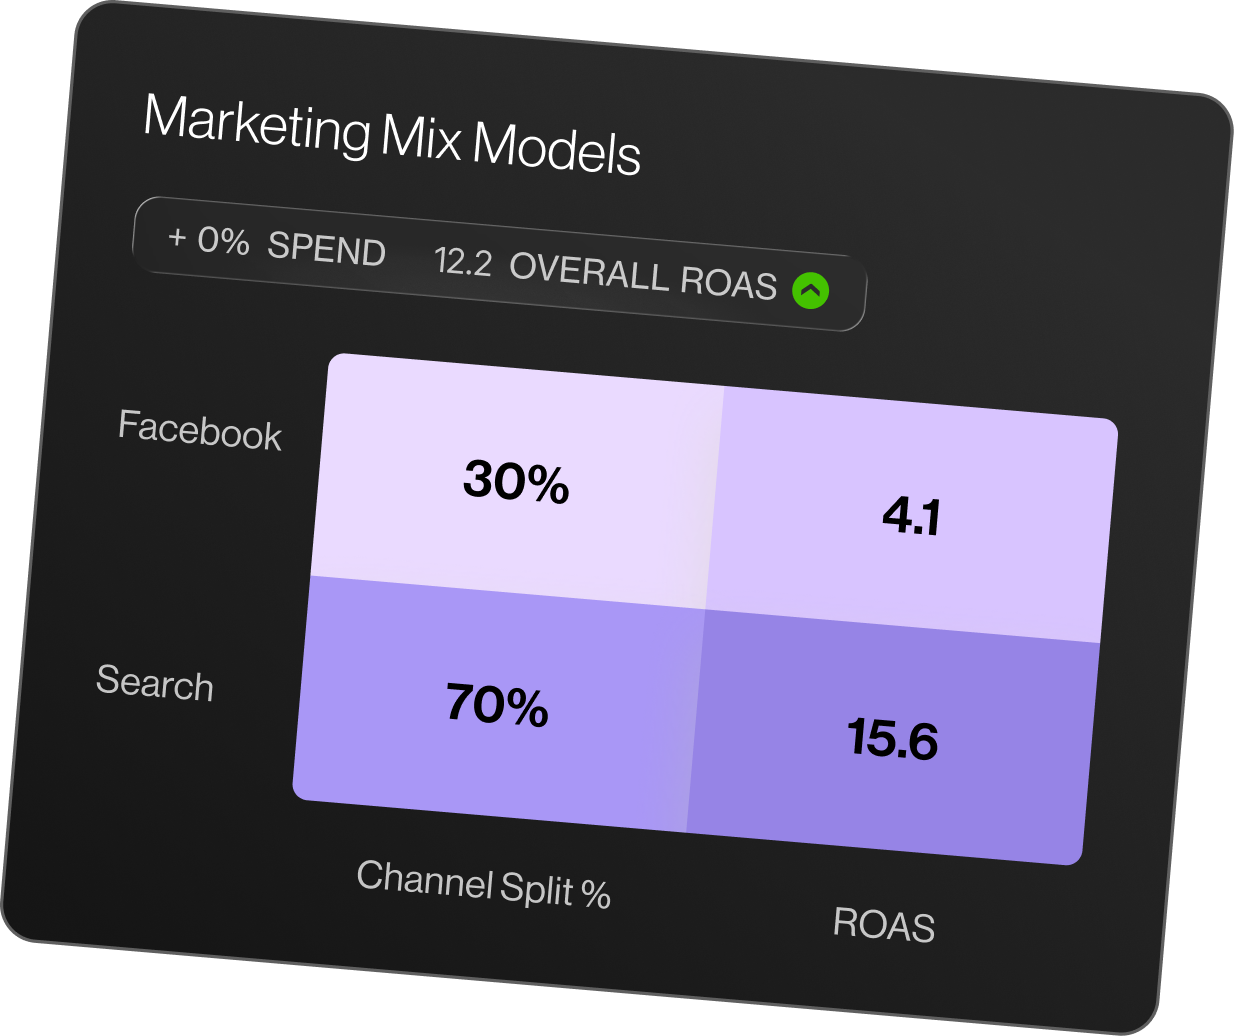
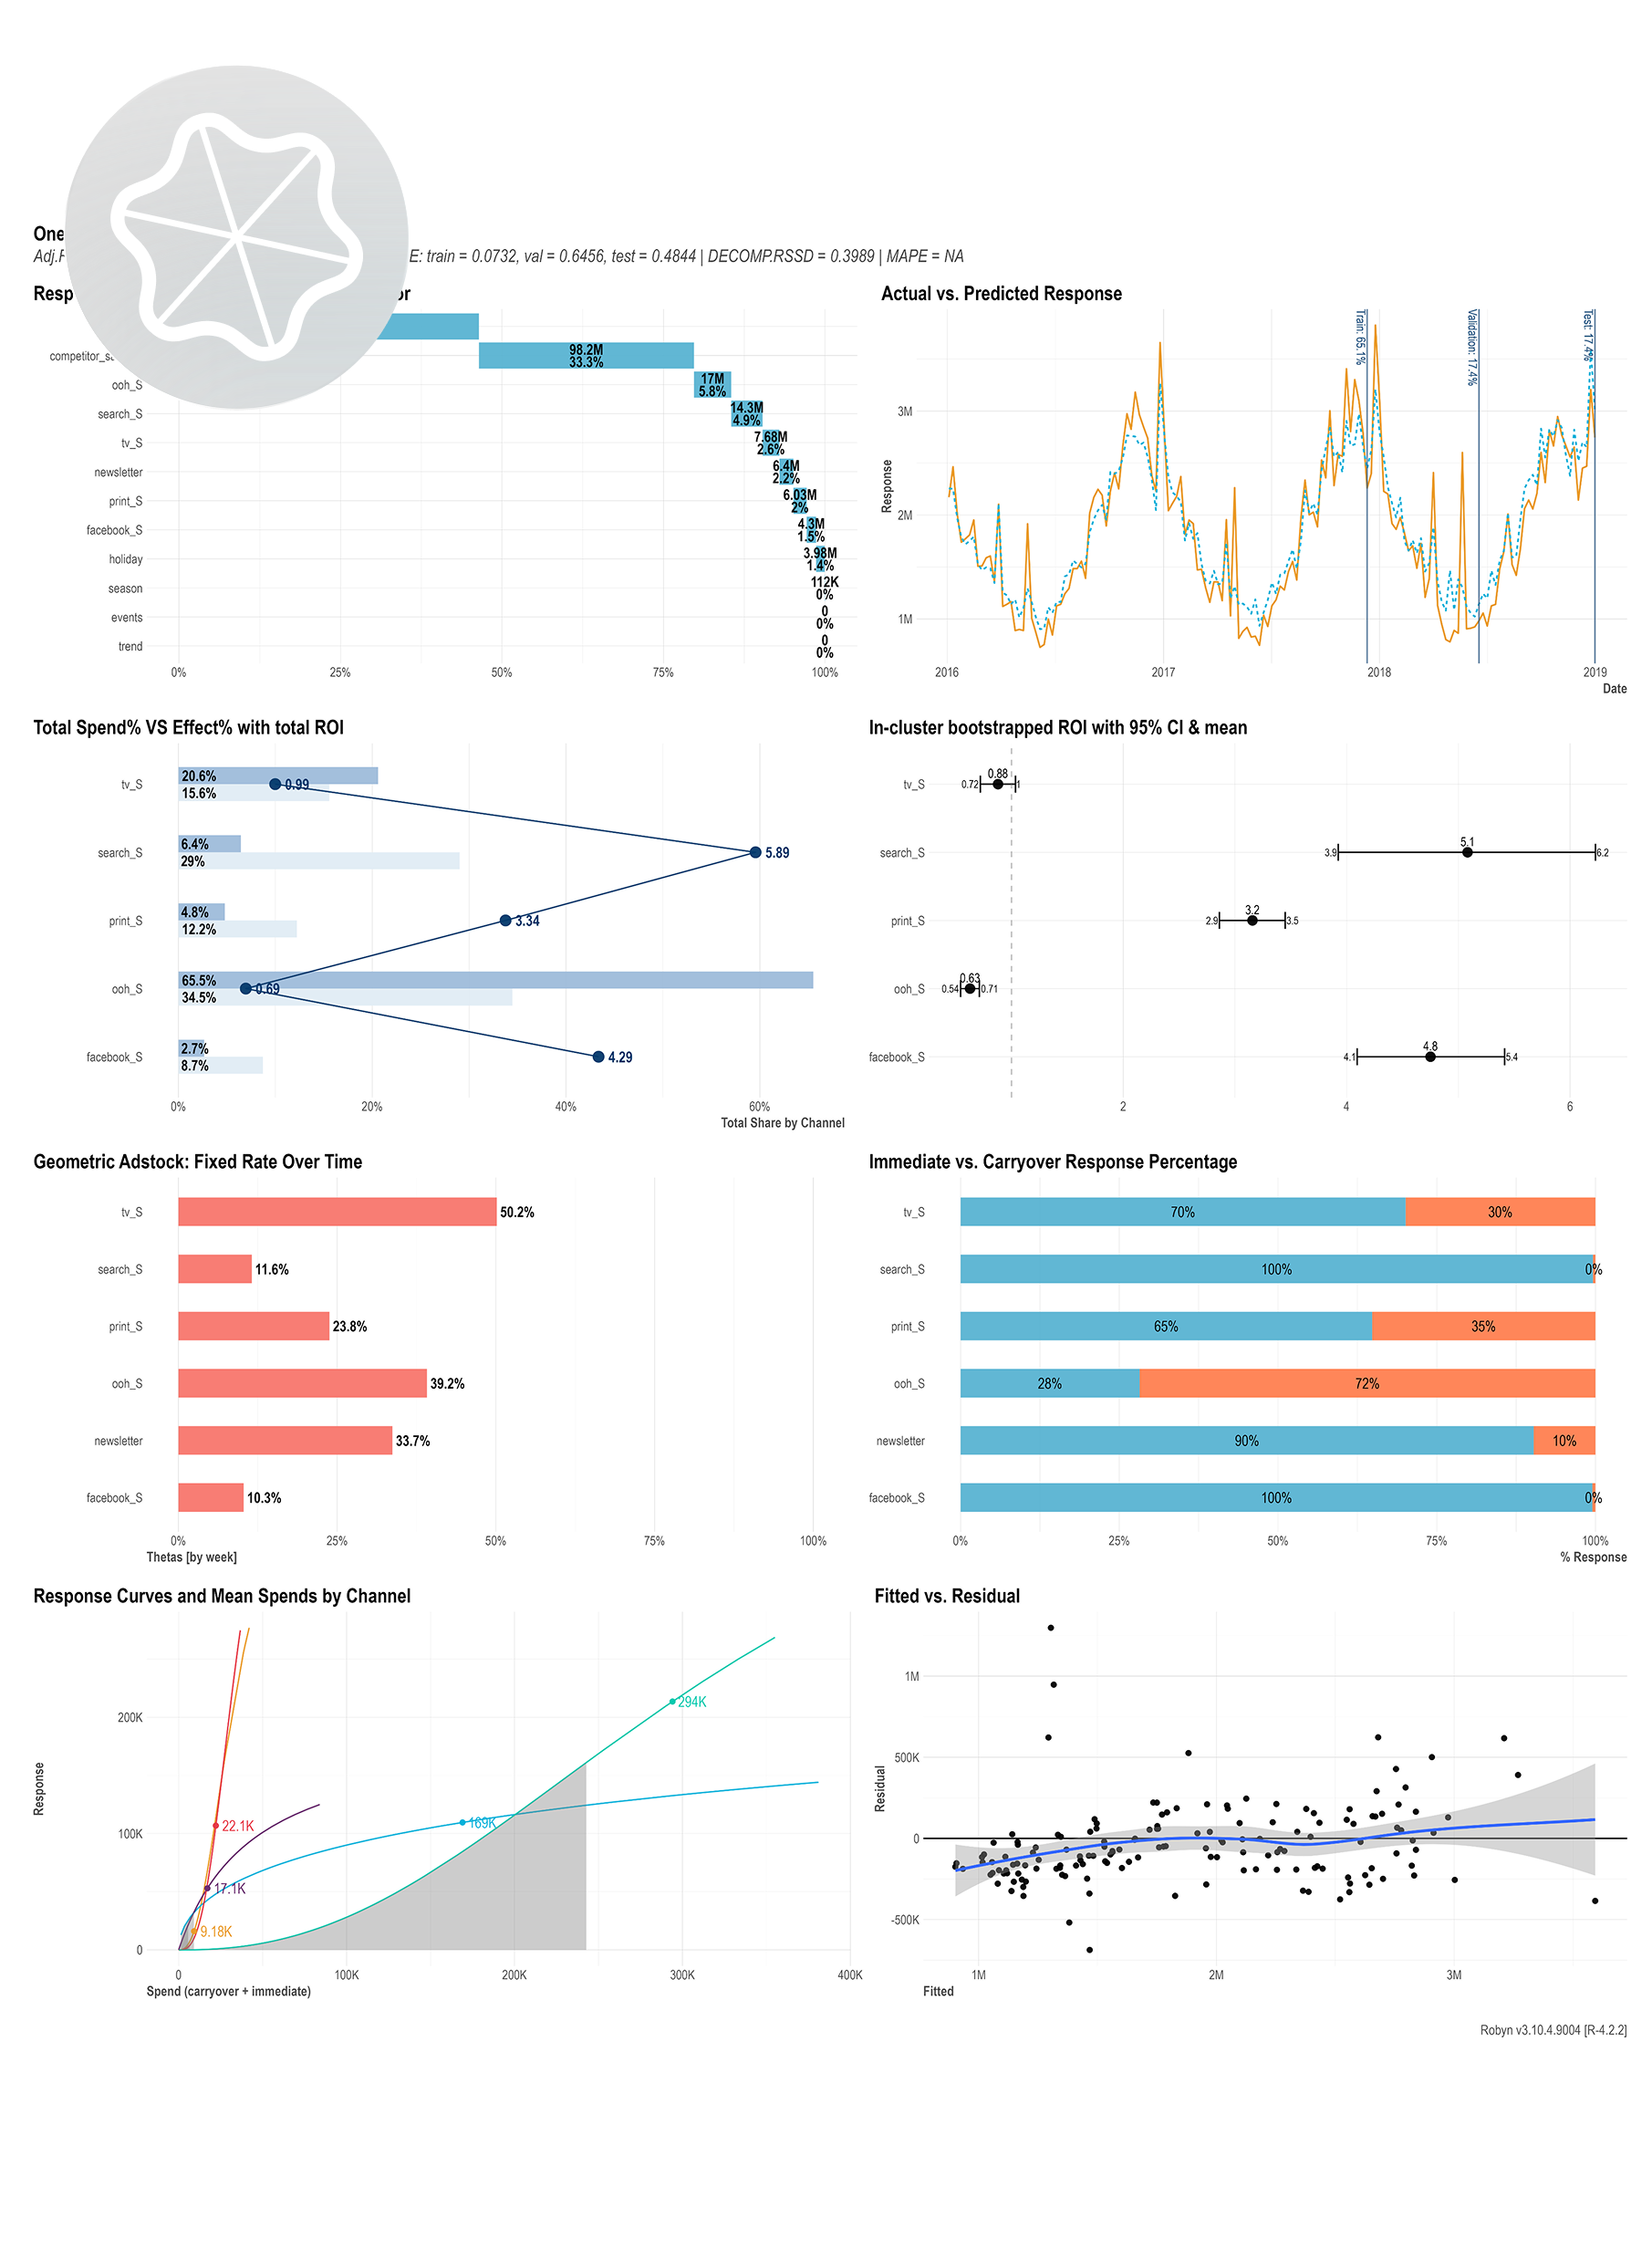
The MMM itself takes BLUNT’s historical spend and sales data and outputs:
Channel contribution & ROI - how much revenue each channel actually drove, on top of baseline sales.
Saturation & response curves - where each channel is on the curve (room to scale vs hitting diminishing returns).
Short vs long-term impact - how much of each channel’s effect is immediate versus brand/carryover.
Budget optimisation scenarios - simulated “what if” plans showing expected revenue and ROAS for different budget mixes.
What we turn it into
Double then translates those technical outputs into a decision pack:
A model summary report that explains the key charts in plain English.
A budget & scenario deck showing recommended reallocations by channel (e.g. “+20% here, -10% there”) and the expected impact.
A clear action playbook for the next budget cycle: where to cut, where to double down, and where not to scale beyond a certain point.
What We Discovered & How They Responded
Three discoveries that transformed their strategy

Google Ads were goldmines

Doubled down on Google Ads

Email was their secret weapon
Used social media to grow email lists
Brand awareness was maxed out
Cut ineffective TOF spending
The Impact
How things changed once we acted on the MMM recommendations.
Google Ads
Investment:
+20%
spend

Results:
+40%
revenue

-30%
cost / conv

Social Media
Investment:
+52%
spend
Results:
+43%
revenue
-39%
cost / conv

Ready to be more like Blunt
and stop guessing?
At Double - We drive digital marketing & strategies to deliver massive growth for businesses who sell large or premium-priced offers. Fast-track your success with our proven digital specialists.